Avocado Oil Authenticity
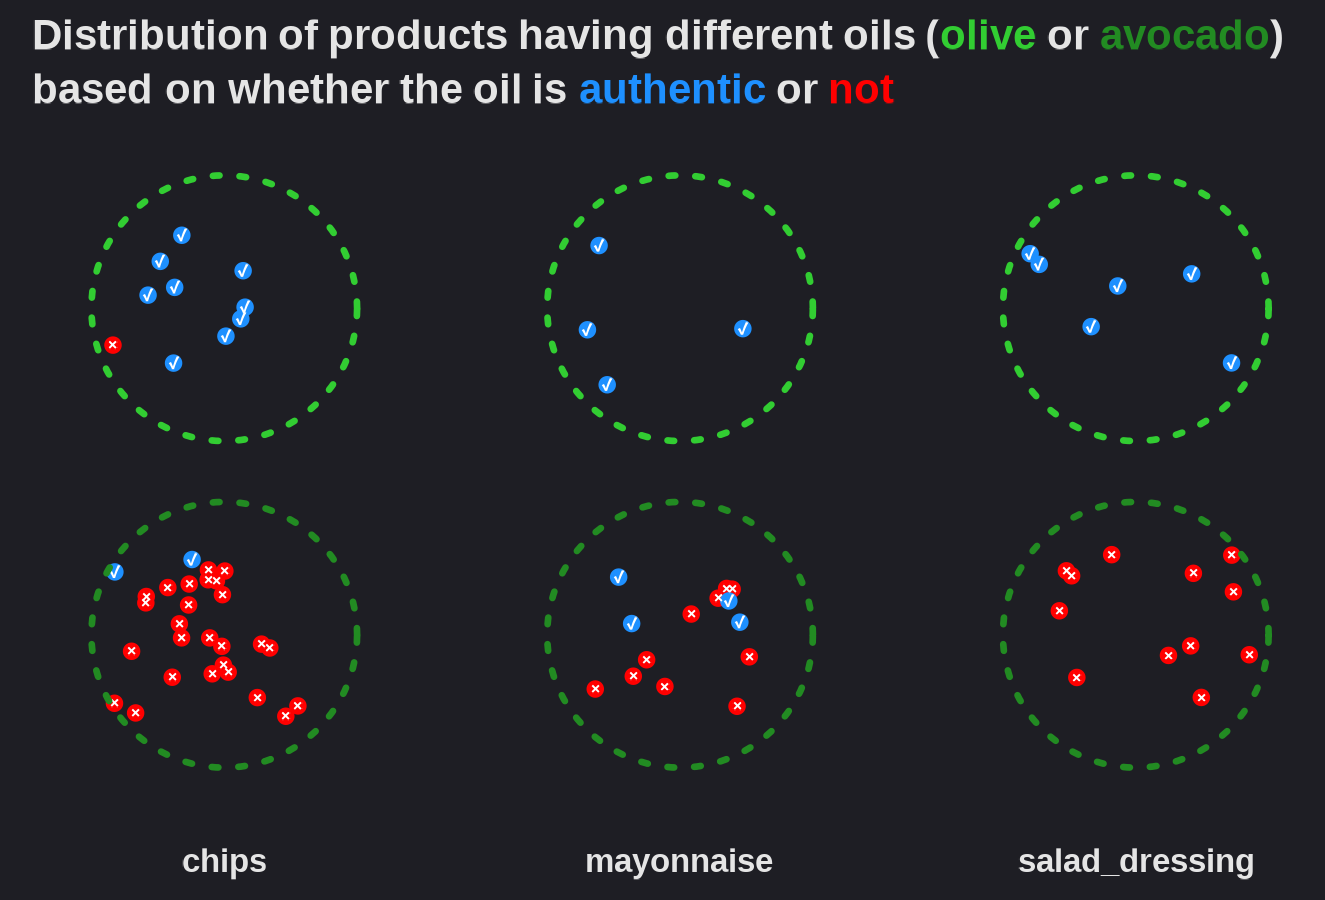
Distribution of different products based on the authenticity of the oil used.
By Manish Datt
TidyTuesday data for 2026-10-06
library(tidyverse)
avocado_oil_processed_foods <- read_csv('https://raw.githubusercontent.com/rfordatascience/tidytuesday/main/data/2026/2026-10-06/avocado_oil_processed_foods.csv')
library(ggforce)
library(ggtext)
library(ggnewscale)

options(repr.plot.width = 10, repr.plot.height = 6)

jit <- position_jitter(width = 0.25, height = 0.25, seed = 789)

avocado_oil_processed_foods |>
  ggplot(aes(x = category, y = oil_type)) +
  # Add points with jitter
  geom_point(position = jit, aes(color = authentic)) +
  scale_color_manual(values = c("FALSE" = "red", "TRUE" = "dodgerblue")) +
  geom_text(aes(label = ifelse(authentic, "✔", "✖")),
            size = 2.5, position = jit, color = "white", show.legend = FALSE) +

  new_scale_color() +

  geom_mark_ellipse(aes(group = interaction(oil_type, category), color=oil_type),
                             linetype = "dotted", linewidth=1.5,
                             expand = unit(2.25, "cm"), label.margin = margin(0,0,0,0,"mm"),
                             show.legend = FALSE) +
  scale_color_manual(values = c("forestgreen", "limegreen")) +
  theme_minimal(base_size = 20) +
  labs(x = NULL, y = NULL,
       title="Distribution of products having different oils (<span style='color:limegreen;'>olive</span> or <span style='color:forestgreen;'>avocado</span>) <br>based on whether the oil is <span style='color:dodgerblue;'>authentic</span> or <span style='color:red;'>not</span>"
  ) +
  theme(legend.position = "none",
        panel.grid = element_blank(),
        plot.title = element_markdown(size = 20, hjust = 0, lineheight = 1.3,
                      margin = margin(l = 40, unit = "pt")),
        axis.text.y = element_blank(),
        text = element_text(face ="bold", color = "grey90"),
        axis.text = element_text(color = "grey90"),
        plot.background  = element_rect(fill = "#1E1E24")
        )
ggsave("fig1.png", dpi = 150, width = 10, height = 6)